
Kemas kini pada 2023-08-25
AscendEX teams up with Dynamic Learning Institute to present the Futures Investment in AscendEX Dynamic Learn course. The first lesson focuses on understanding candlesticks. We begin with the foundational single candlestick patterns and progressively delve into the secrets behind them.
Candlestick charts were invented by Munehisa Homma, a rice merchant in Japan during the Edo period in 1705. These charts were designed to record rice market trends and price fluctuations. A single candlestick comprises four price points: open, high, low, and close.
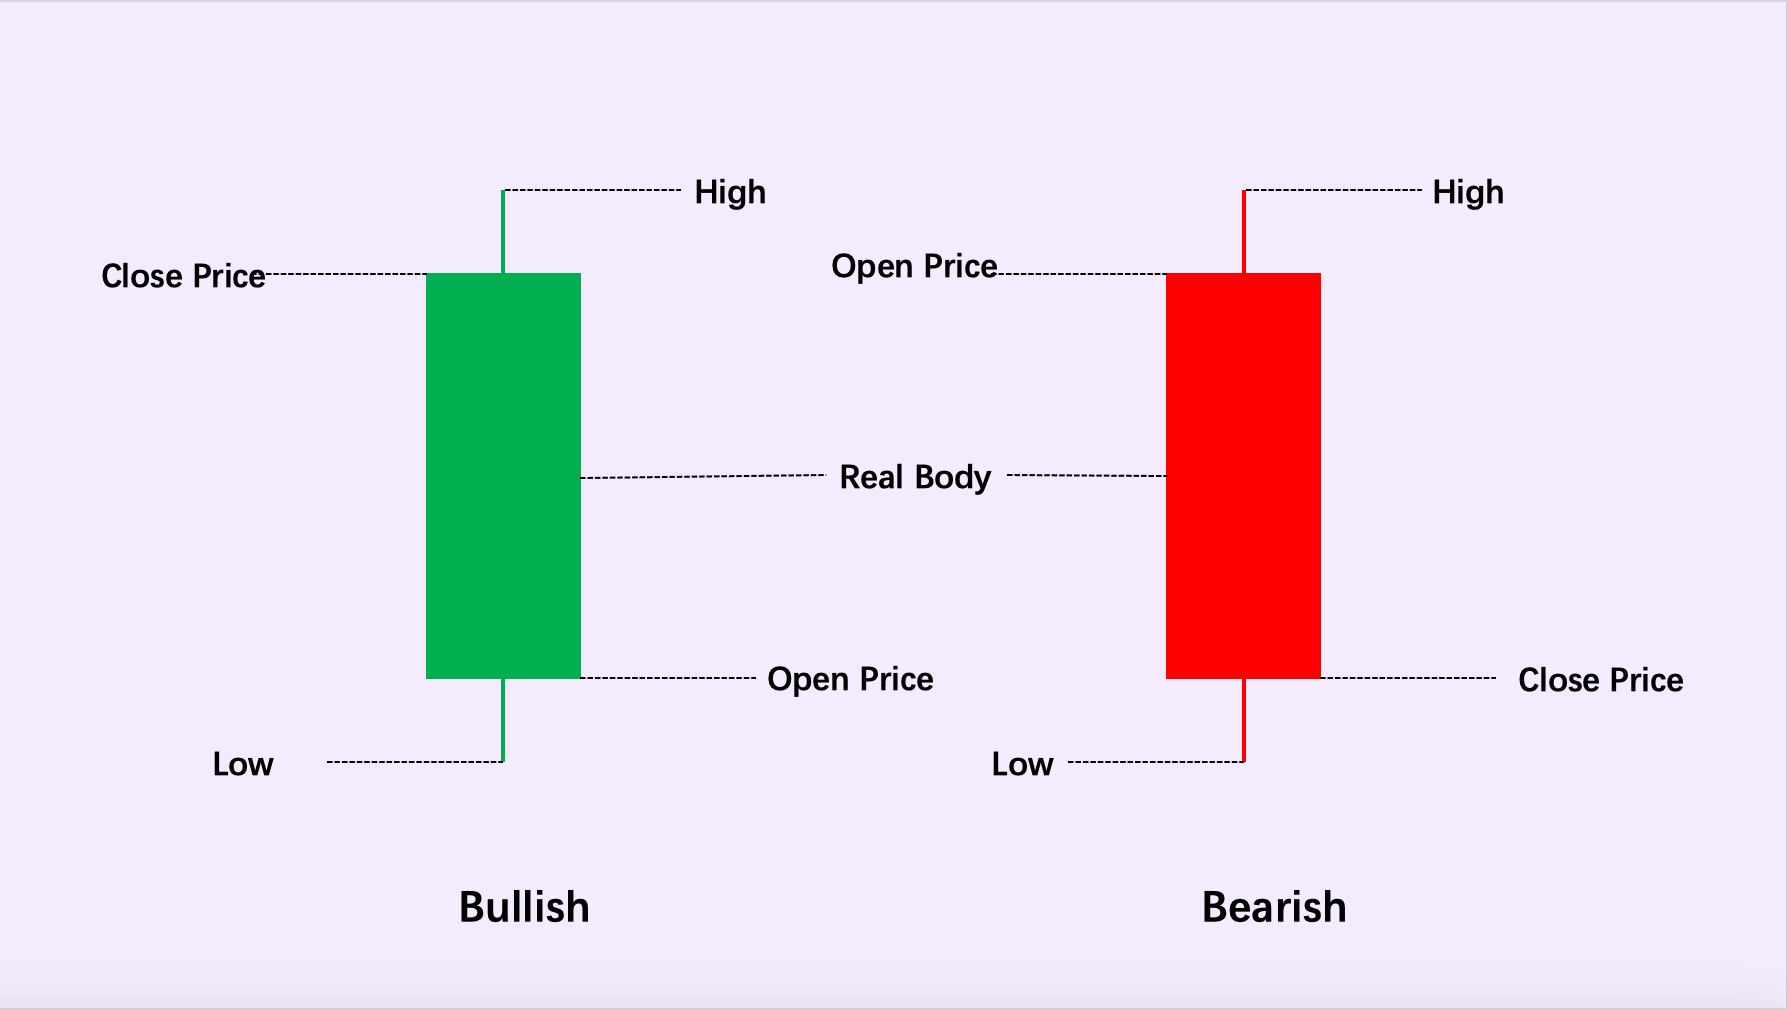
(Note: The illustrated candlestick chart displays upper and lower shadows, but due to the four mentioned price variations, not every candlestick includes these elements.)
Based on the relationship between the opening and closing prices, candlesticks can be divided into two types: Bullish and Bearish.
Bullish Candlestick: Closing price is higher than the opening price, indicating an increase; usually depicted in green in the crypto market.
Bearish Candlestick: Closing price is lower than the opening price, indicating a decrease; typically shown in red in the crypto market.
Note: The color distinction of red and green isn't a fixed standard to differentiate and label bullish and bearish candlesticks. Traditional stock markets often use "red for bearish and green for bullish" to mark these. The "green for bullish and red for bearish" mentioned above is just a common practice in the crypto market; investors can adjust based on their own preferences.
(2) Classification of Single Candlesticks
Market conditions can lead to the aforementioned types of price movements, resulting in different candlesticks. Below, we present the common 16 candlesticks along with the market signals they imply.
1. Small Green Marubozu
This candlestick signifies that the opening price equals the lowest price and the closing price equals the highest price. The term "small" refers to the small real body, with narrow price fluctuations. It indicates that the buying strength is gradually increasing, with temporary slight dominance of the bullish side. It often occurs during the early stages of an uptrend, at the end of a pullback, or during consolidation.

2. Small Red Marubozu
This pattern signifies that the opening price equals the highest price and the closing price equals the lowest price. Similarly, the term "small" refers to the small real body, with limited price fluctuations. It indicates that the selling strength has slightly increased, with temporary minor dominance of the bearish side. It often appears at the beginning of a downtrend, during sideways consolidation, or at the end of a rebound.
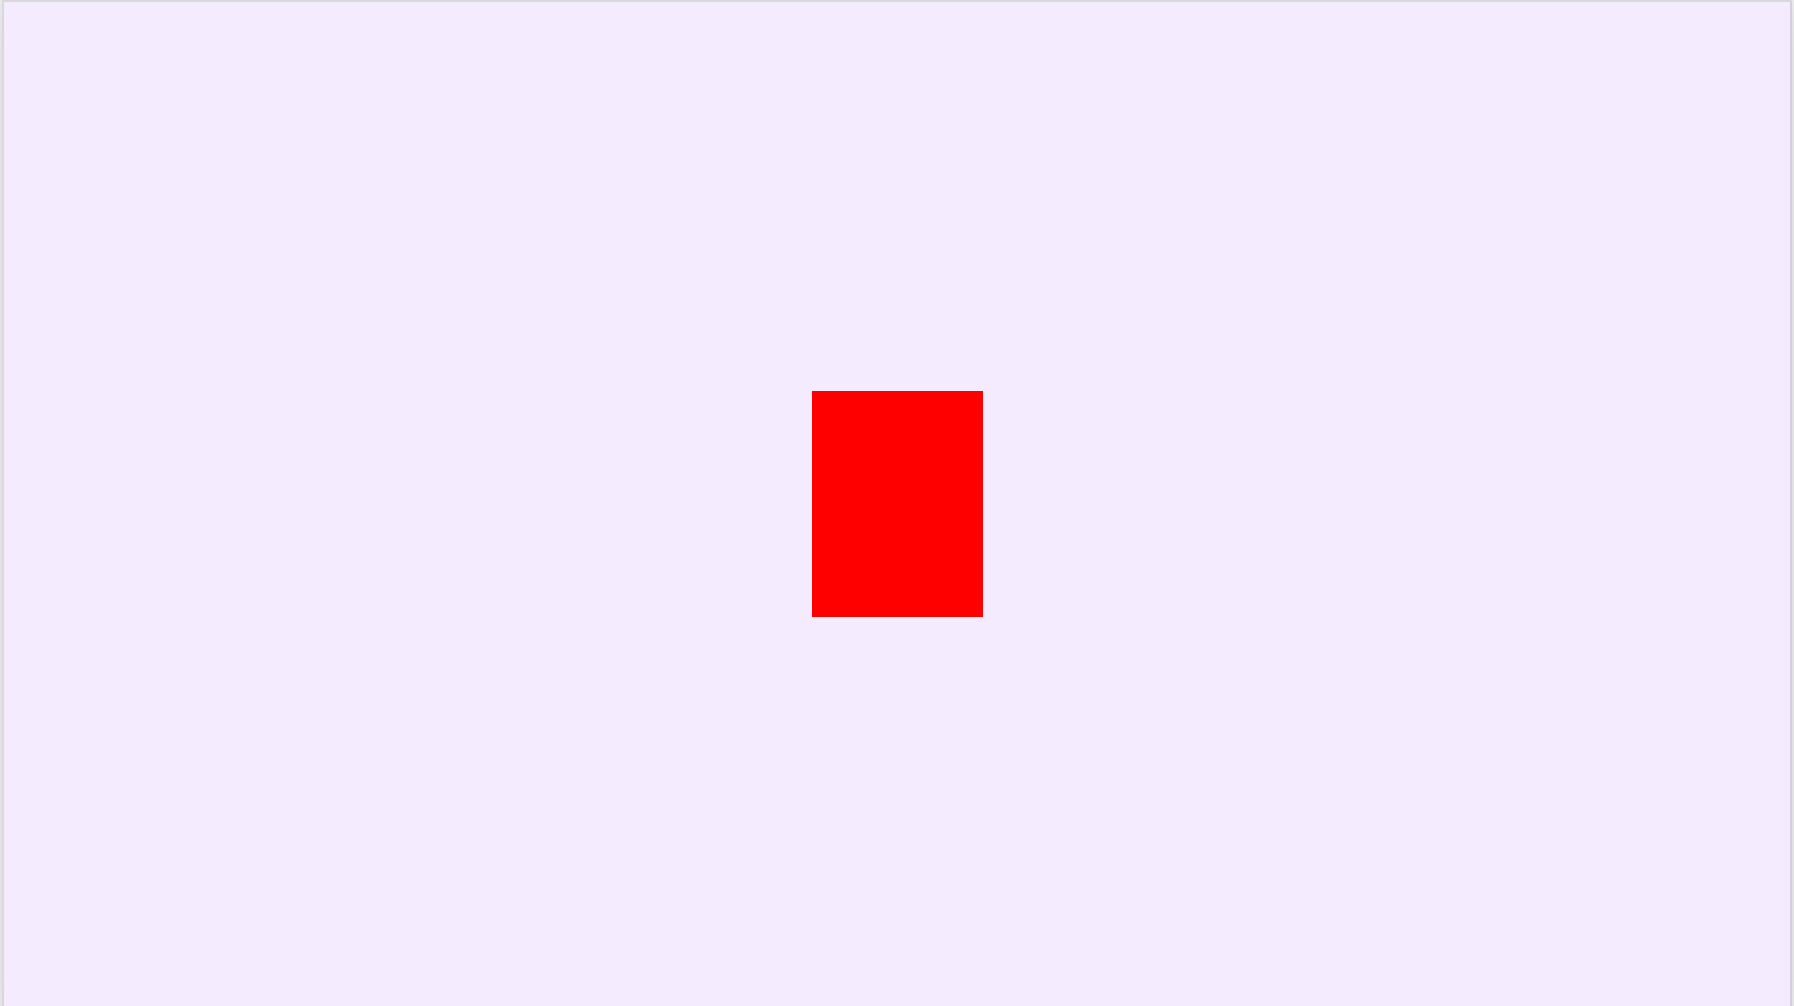
3. Green Marubozu Full
This candlestick has no upper or lower shadows, with a relatively large real body. It indicates a strong bullish trend where buyers hold an absolute advantage, and sellers are unable to resist. It often emerges at the early stages of a market bottom breakout, after the end of a pullback followed by a further rise, during the upward phase at high levels, or sometimes during intense rebounds after significant overselling.

4. Red Marubozu Full
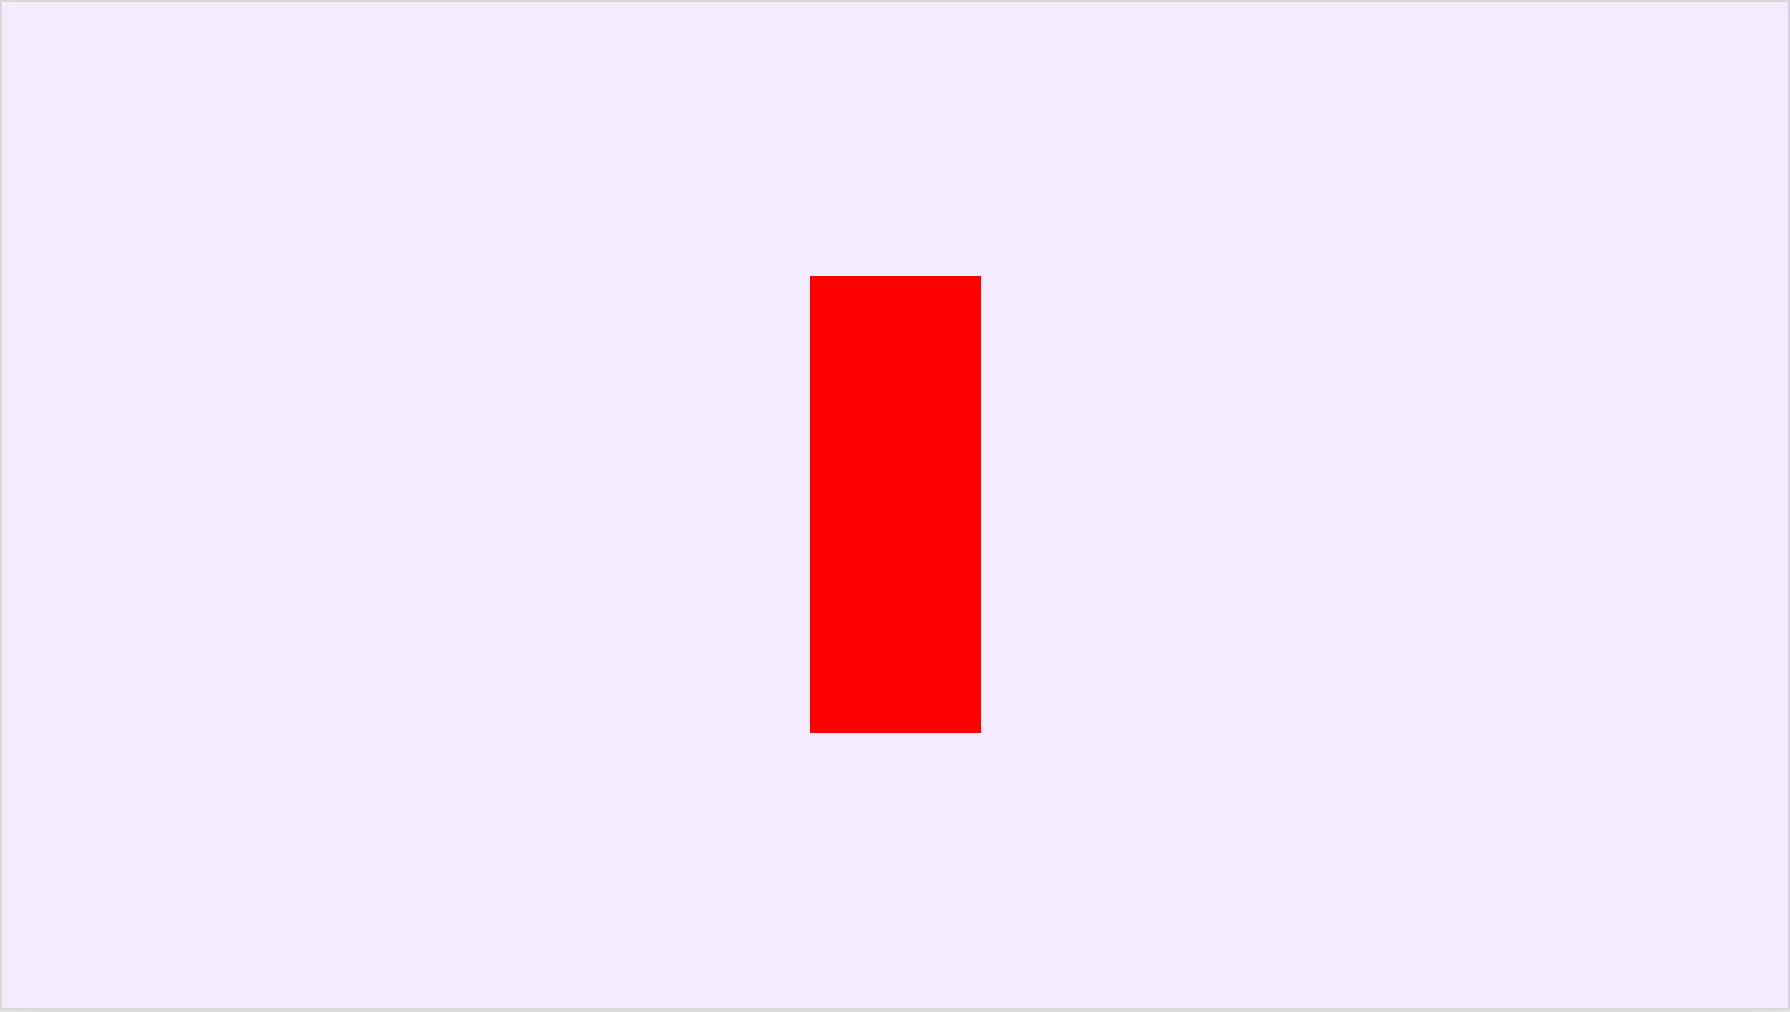
This pattern has no upper or lower shadows, with a relatively large real body. It shows a robust bearish trend where sellers have an absolute advantage and buyers are powerless to resist. It frequently appears at the initial stages of a top formation leading to a decline or during the suppression phase after the end of a rebound.
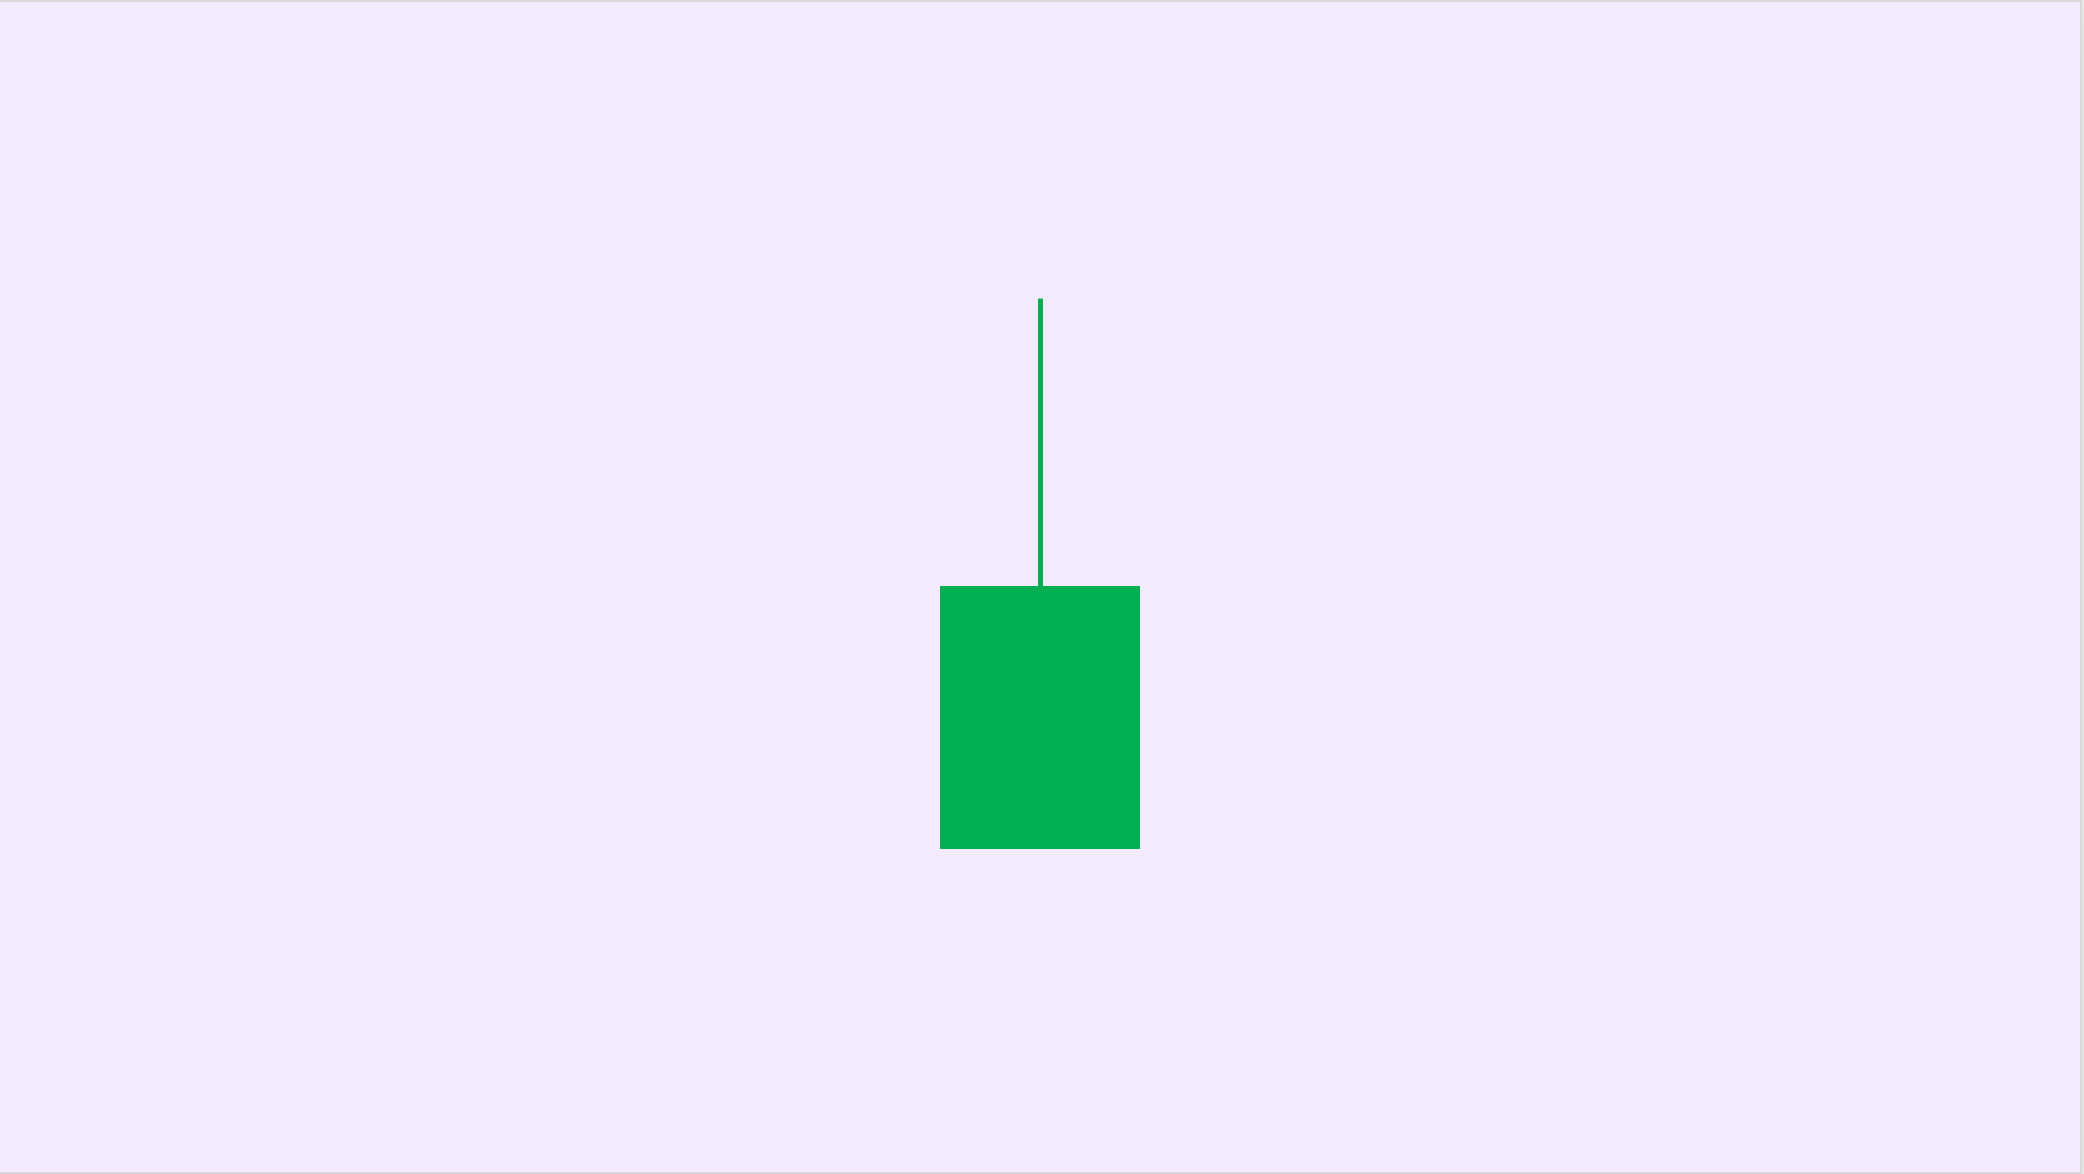
5. Bullish Opening Marubozu
This is an ascending resistance type, indicating that the bullish side encounters resistance during its upward movement. It often emerges during the uptrend, at the end of uptrend, or when the price encounters a dense trading volume while moving upwards. The proportion of the upper shadow to the real body can reflect the degree of resistance faced by the bullish side. A longer upper shadow indicates greater pressure, while a larger real body suggests stronger bullish strength.
6. Bearish Closing Marubozu
This is also an ascending resistance type, reflecting resistance encountered by the bullish side during its upward movement. It frequently appears during the uptrend, at the end of uptrend, or when the price encounters a dense trading volume. The proportion of the upper shadow to the real body indicates the degree of resistance faced by the bullish side. A longer upper shadow indicates higher pressure.
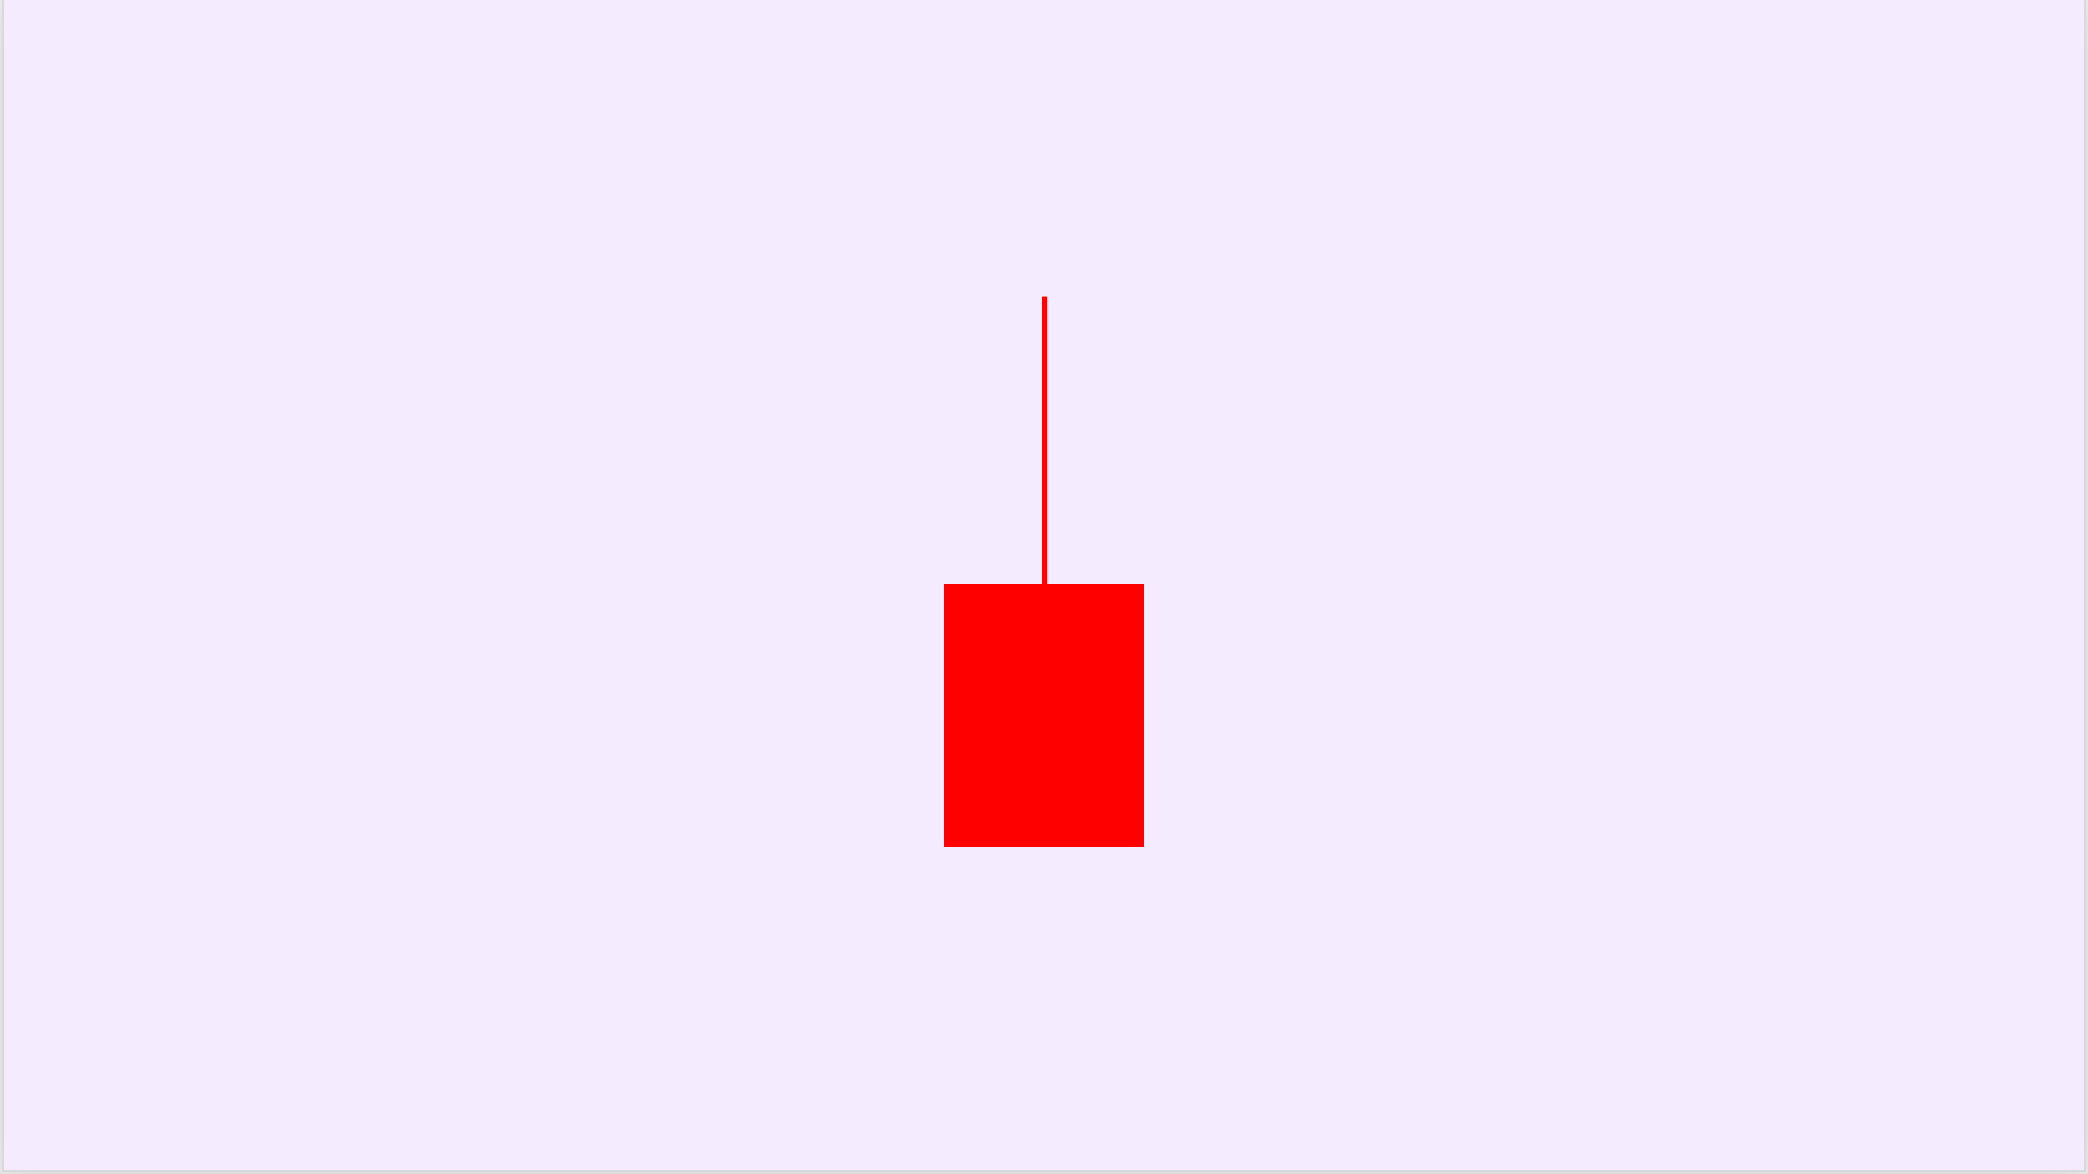
7. Bullish Closing Marubozu
This is a falling-rising type (also known as a falling resistance type), reflecting that the price receives support from buyers at a low level and sellers are frustrated. It suggests the possibility of an upward movement in the future (unless the real body is excessively long).

8. Bearish Opening Marubozu
This is also a falling-rising type or falling resistance type, indicating strong bearish strength but encountering some resistance from buyers during the downward movement. It frequently appears during the downtrend. The longer the lower shadow, the stronger the buying strength.
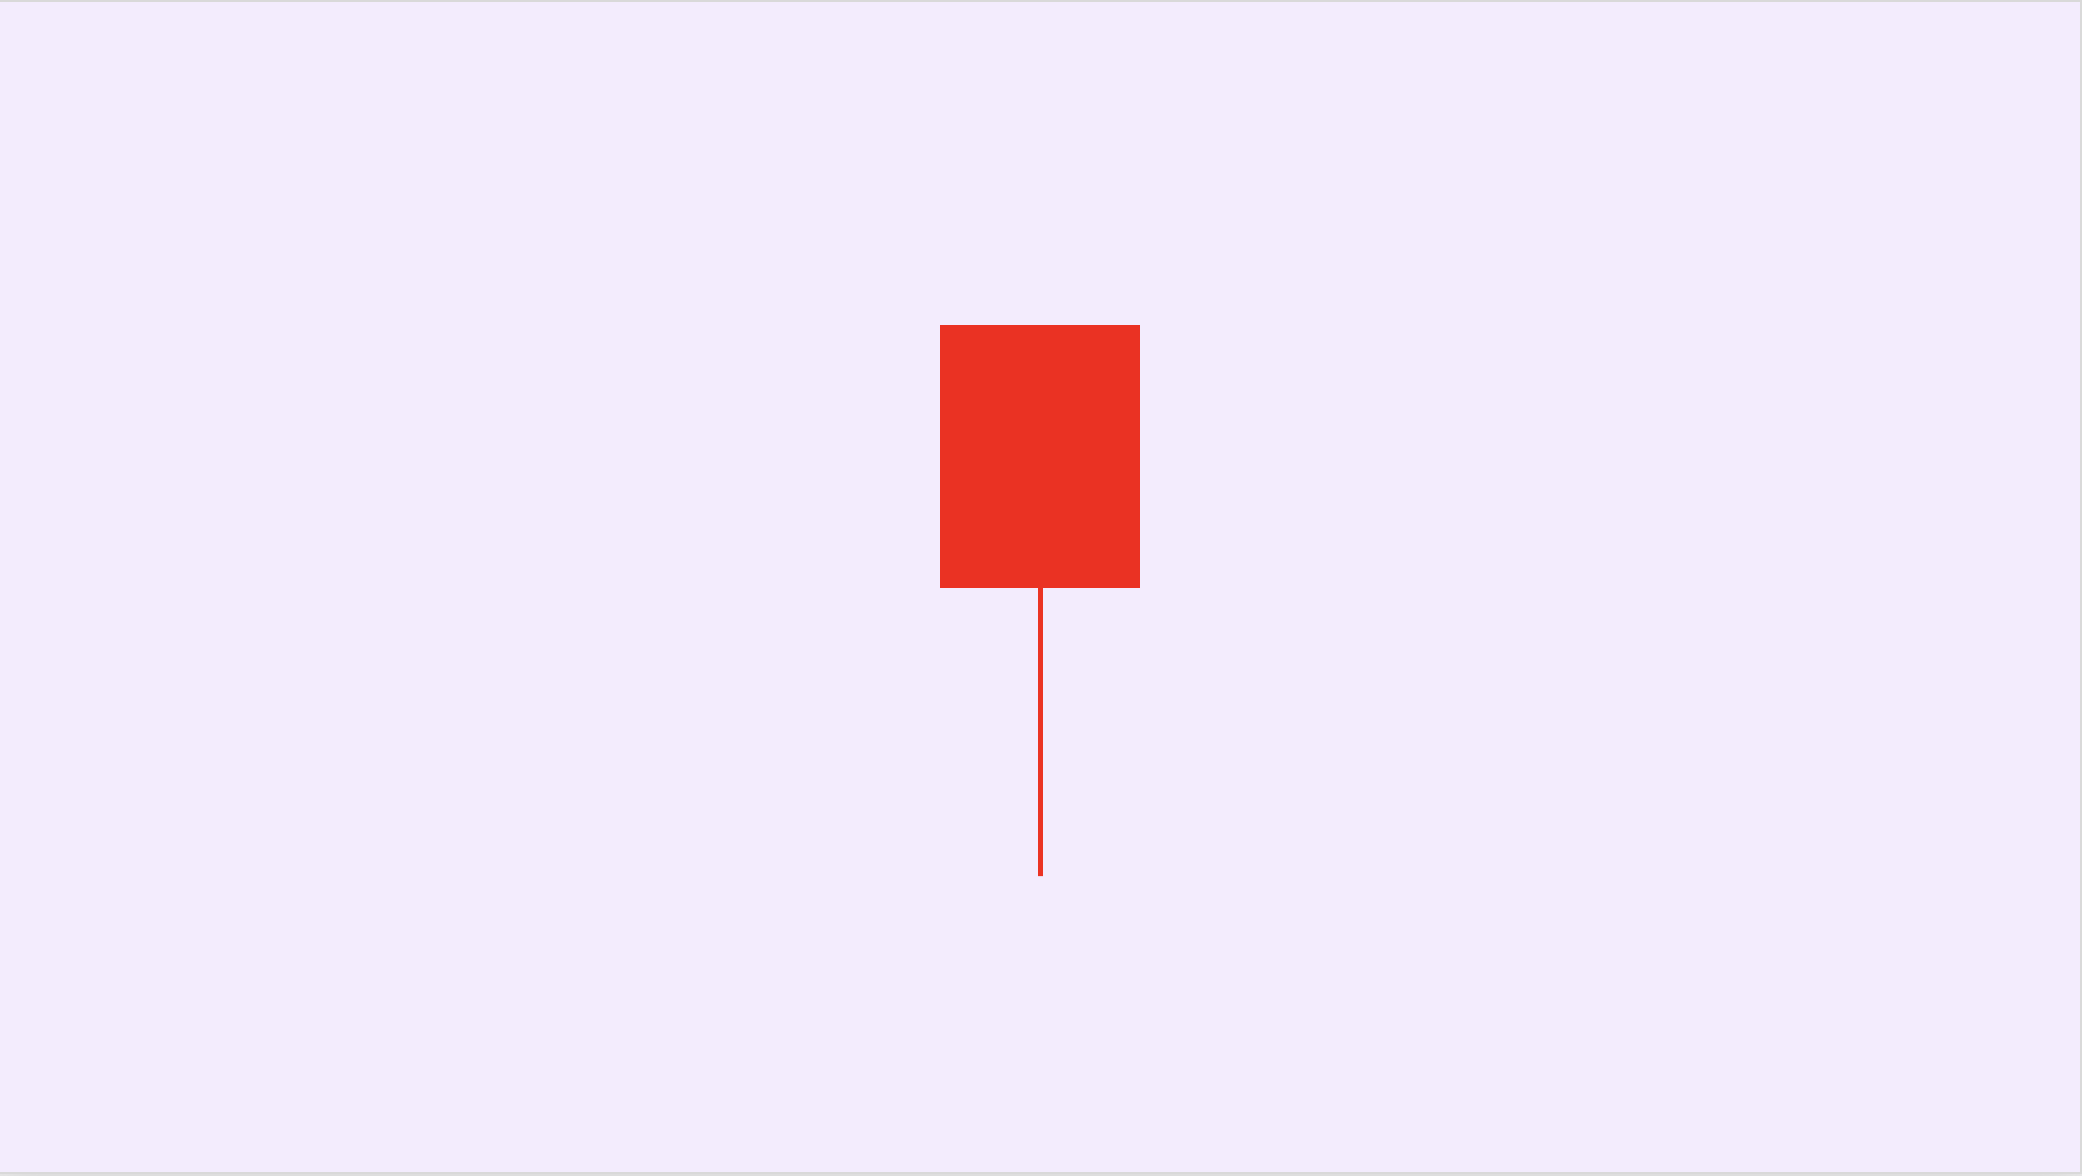
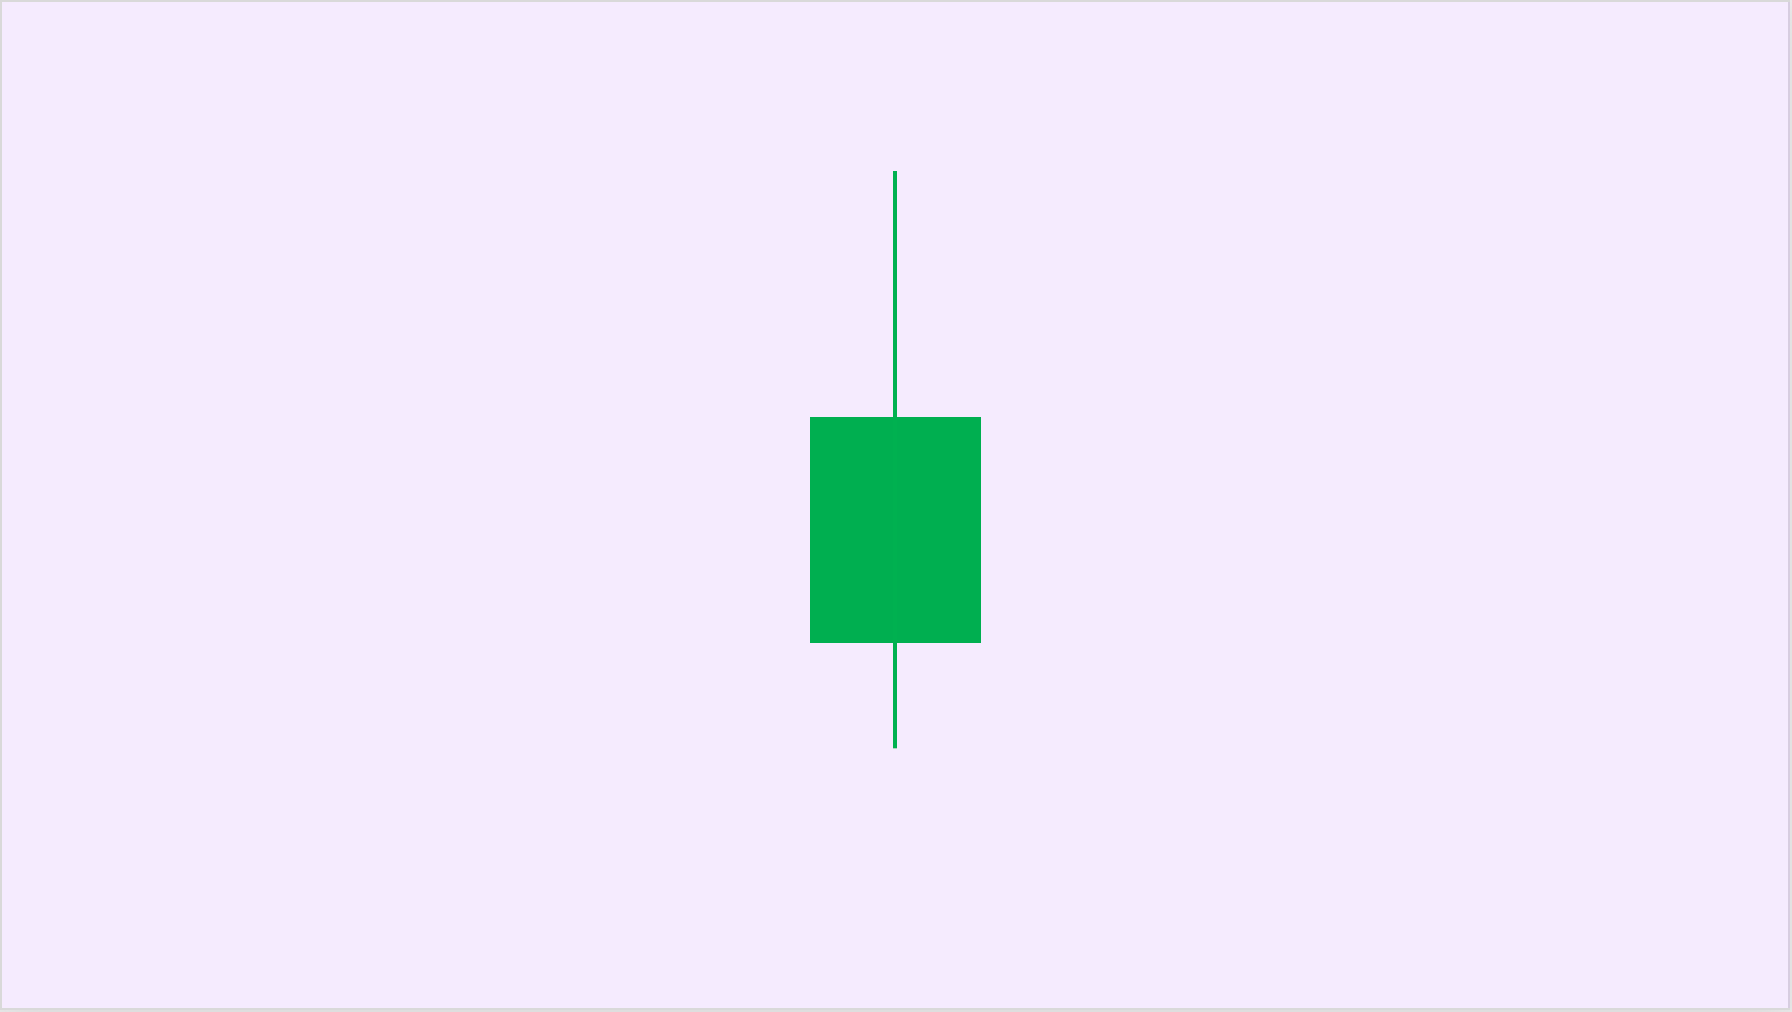
9. Bullish Candlestick with Upper and Lower Shadows
This candlestick signifies support below and pressure above, with an overall advantage for the bullish side. It often appears at the market bottom or during its upward movement. A longer upper shadow indicates higher pressure from above, while a longer lower shadow suggests stronger support from below. A larger real body implies greater bullish strength.
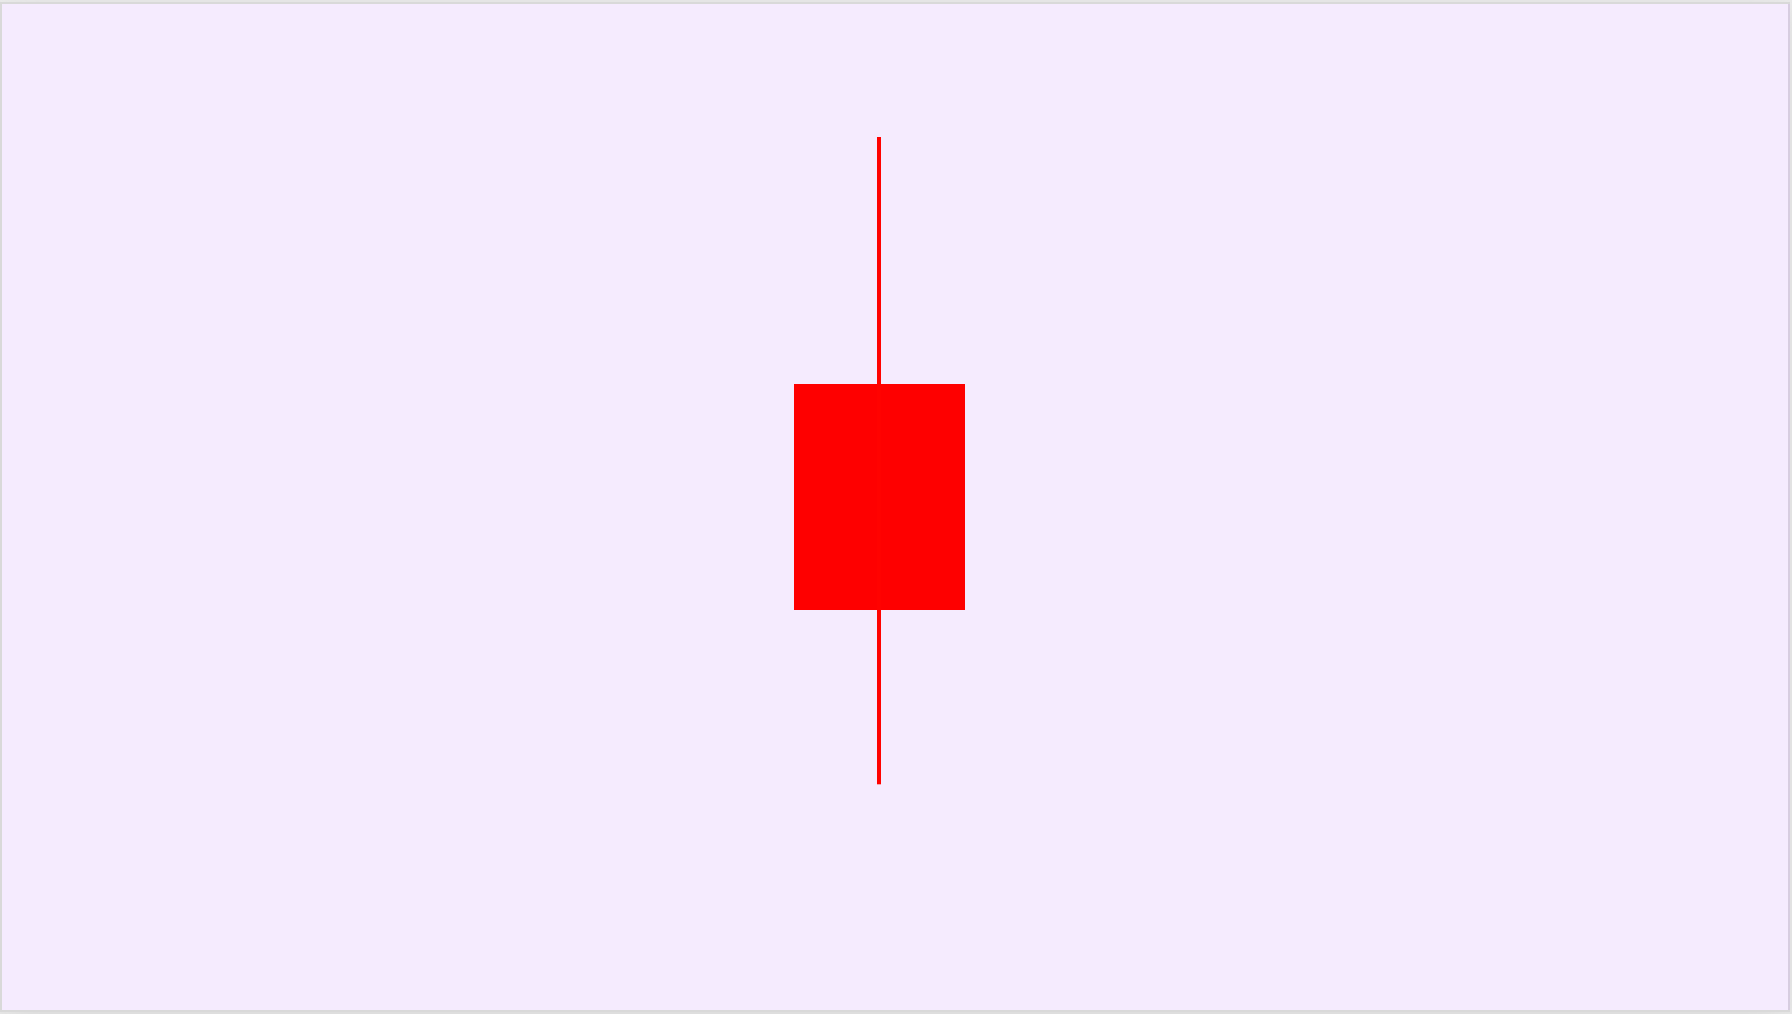
10. Bearish Candlestick with Upper and Lower Shadows
This candlestick also indicates support below and pressure above, with an overall advantage for the bearish side. It often appears at the market bottom or during its upward movement. A longer upper shadow indicates higher pressure from above, while a longer lower shadow suggests stronger support from below. A larger real body implies greater bearish strength.
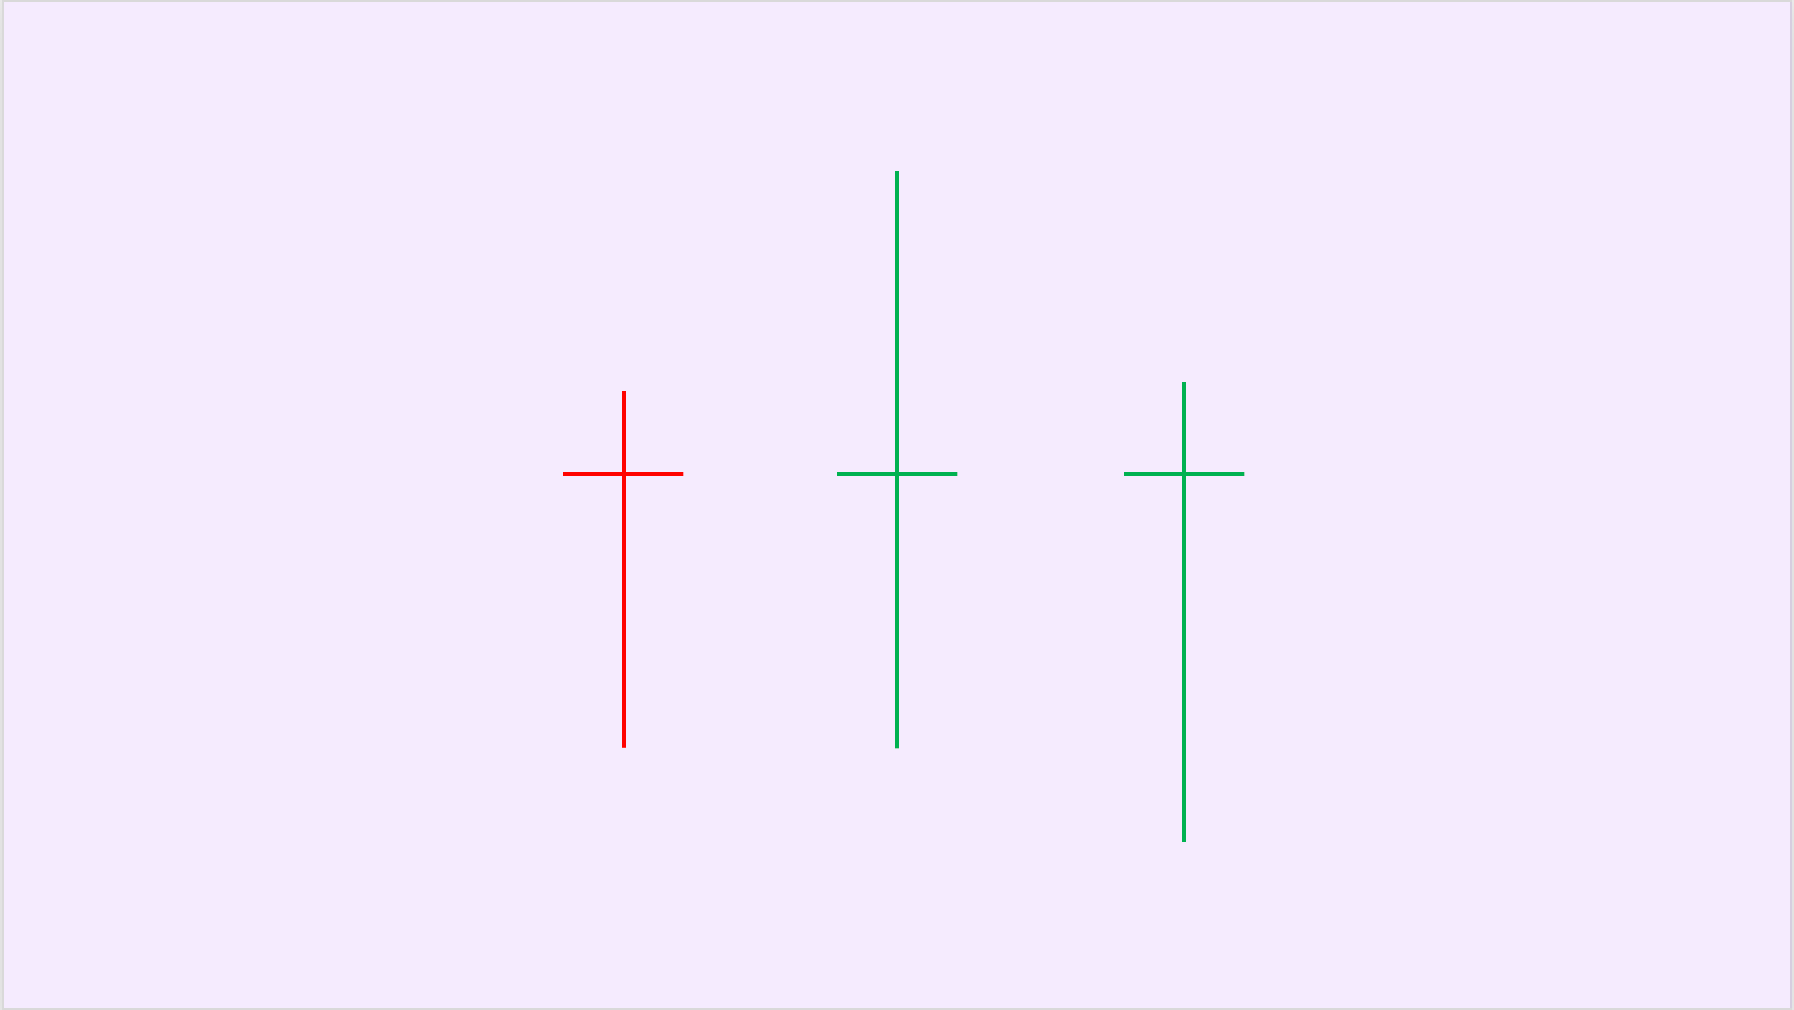
11. Star Doji
This candlestick indicates that the opening price and closing price are the same, signifying a temporary balance between bullish and bearish sides.
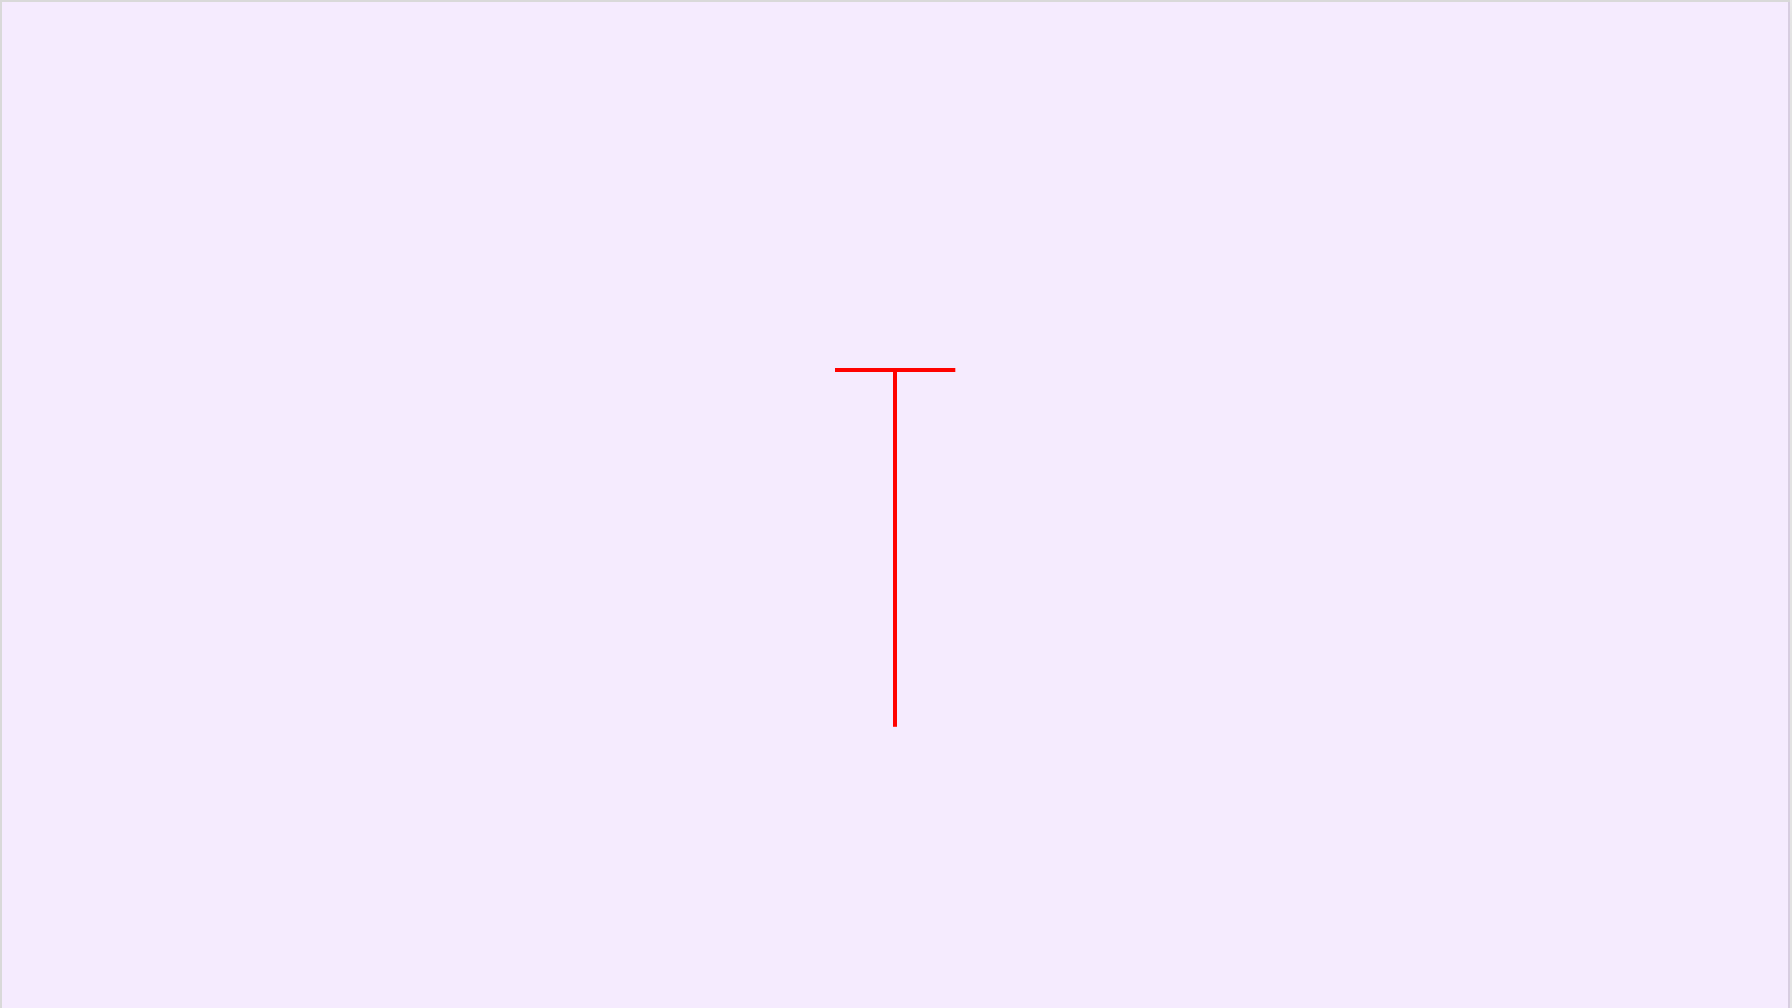
12. Dragonfly Doji
It is a variation of Star Doji, representing the opening price and closing price being the same. The lower shadow suggests there's support below, indicating a potential upward reversal.
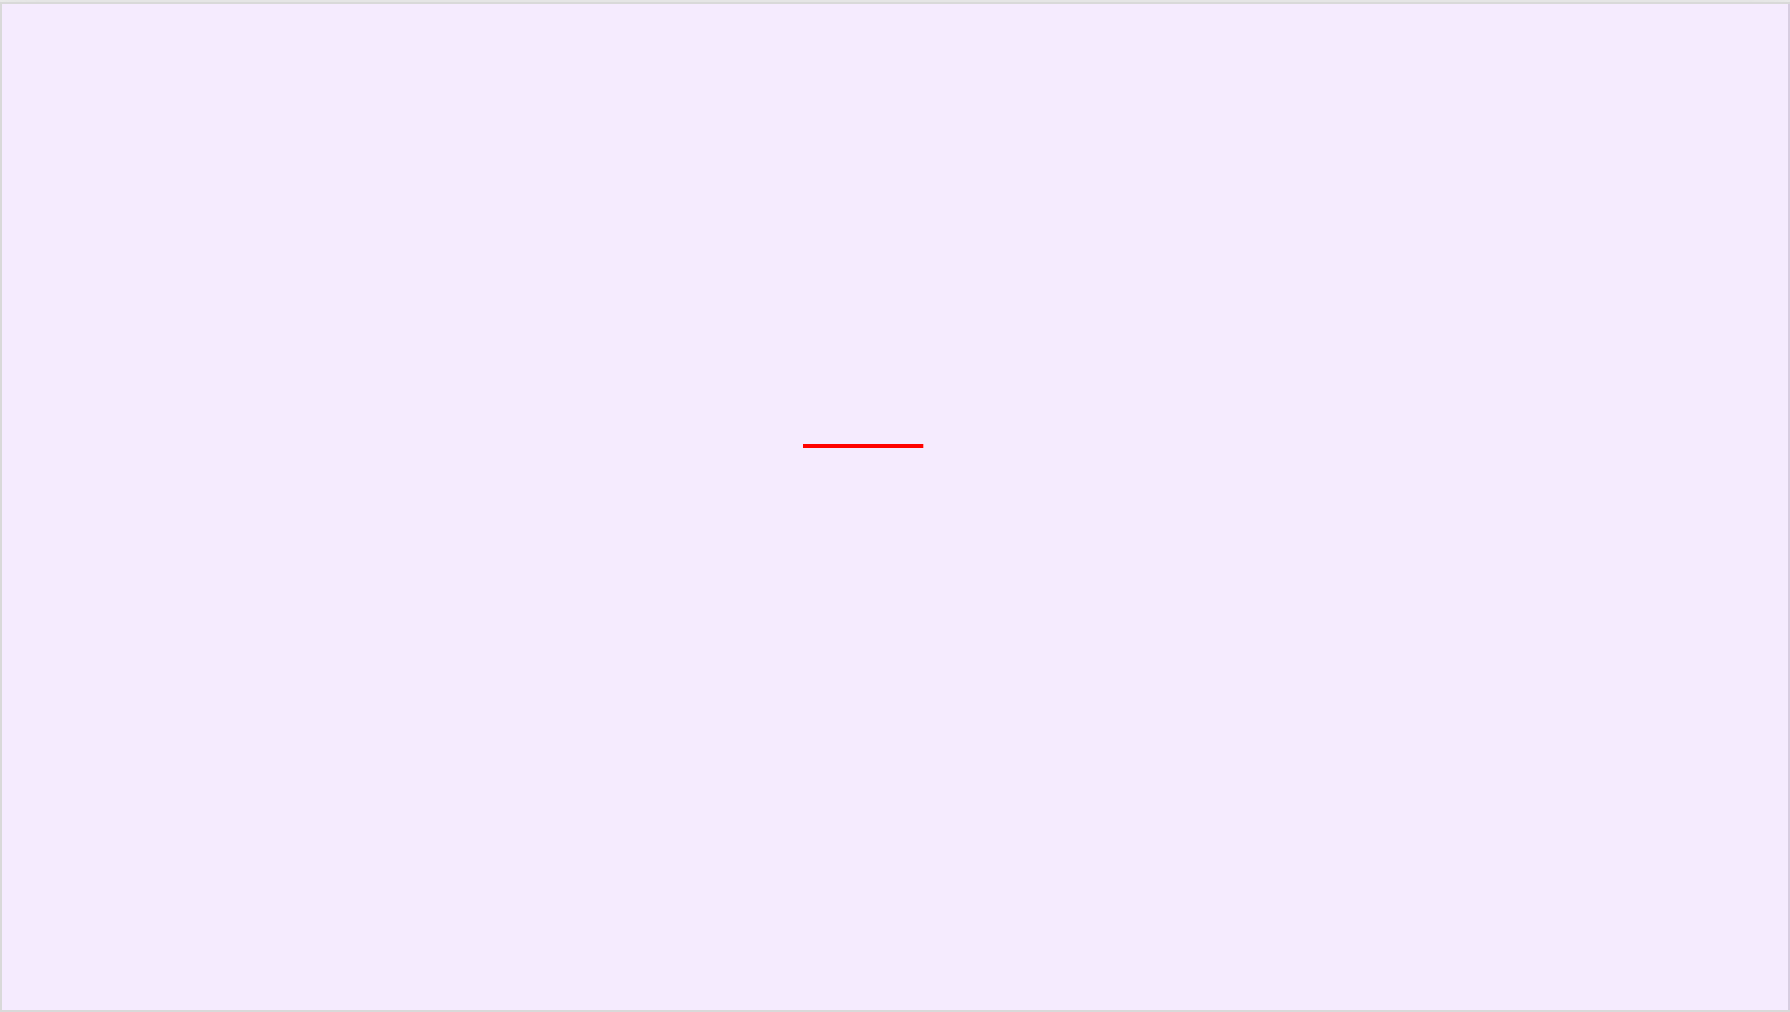
13. 4-Price Doji
This candlestick reflects that the opening, high, low, and closing prices are at the same level. It signifies no change in price during that time frame. While it can appear on minute charts, it's rarely seen on longer-term candlestick charts.
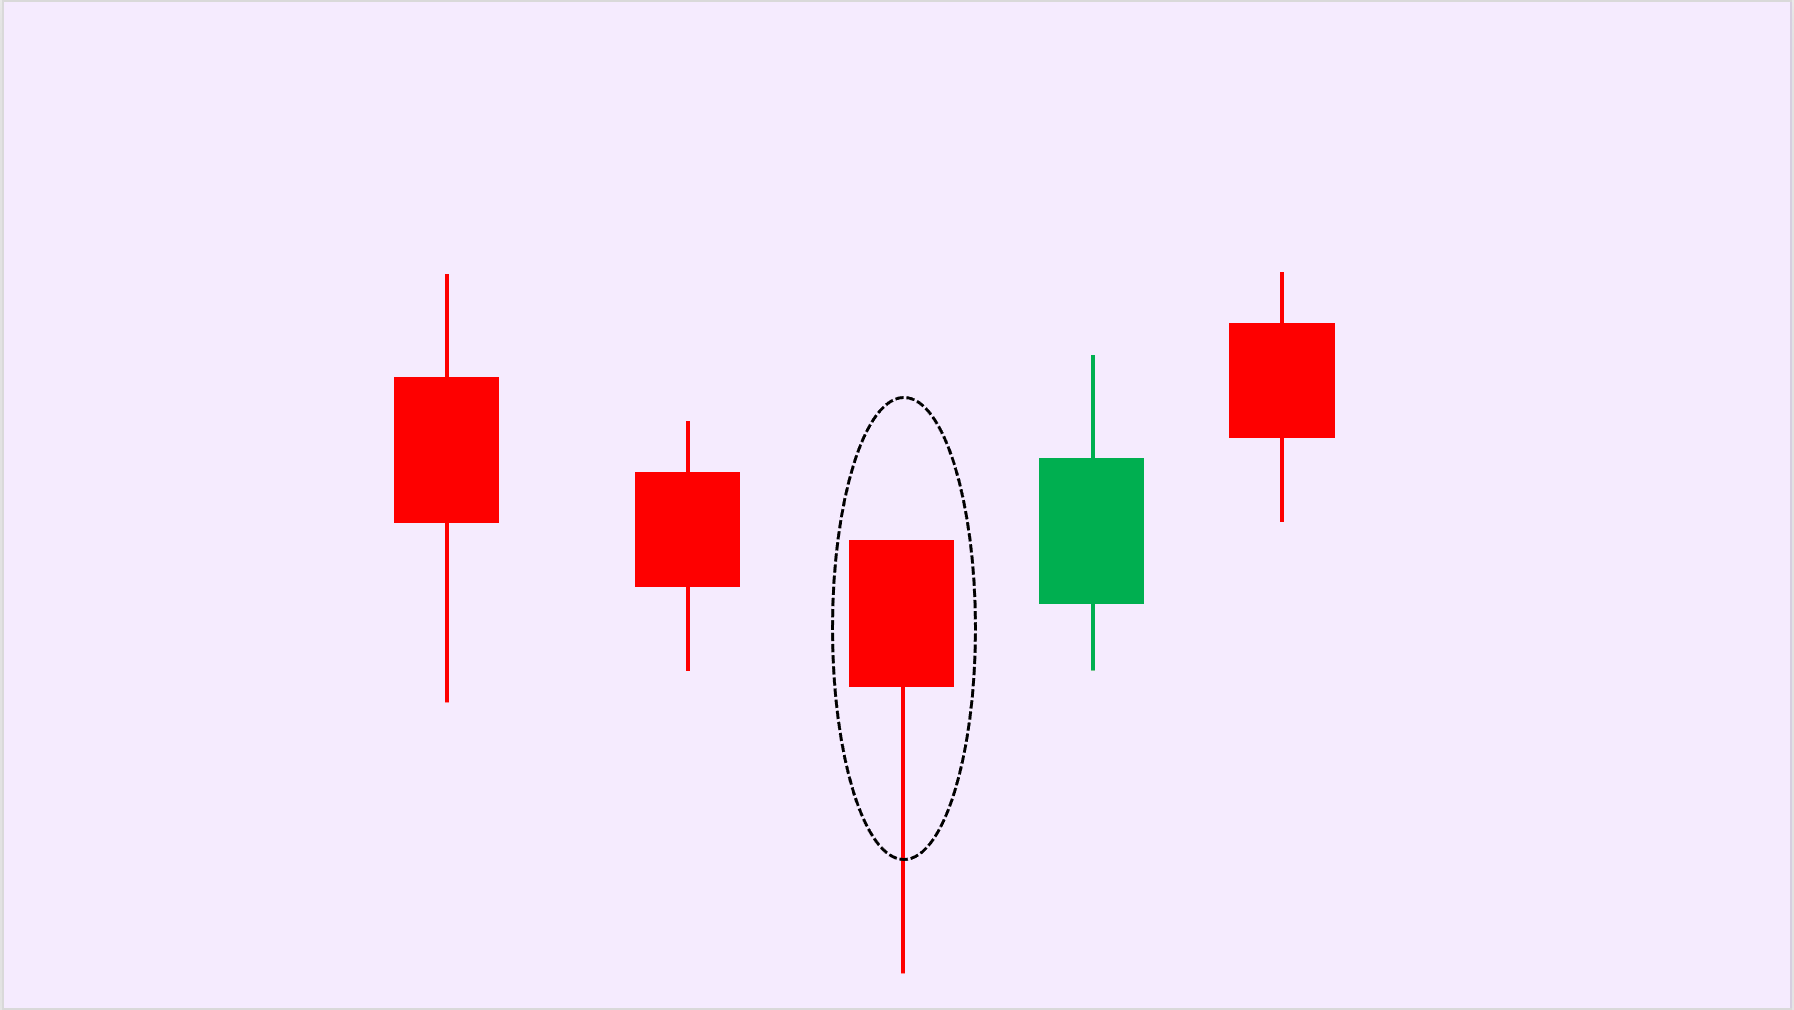
14. Hammer
In a prolonged downtrend, the appearance of a hammer suggests the downtrend may be ending. This type of relatively reliable candlestick can be a bullish or bearish hammer. It features almost no upper shadow and a lower shadow that's more than twice the length of the real body.
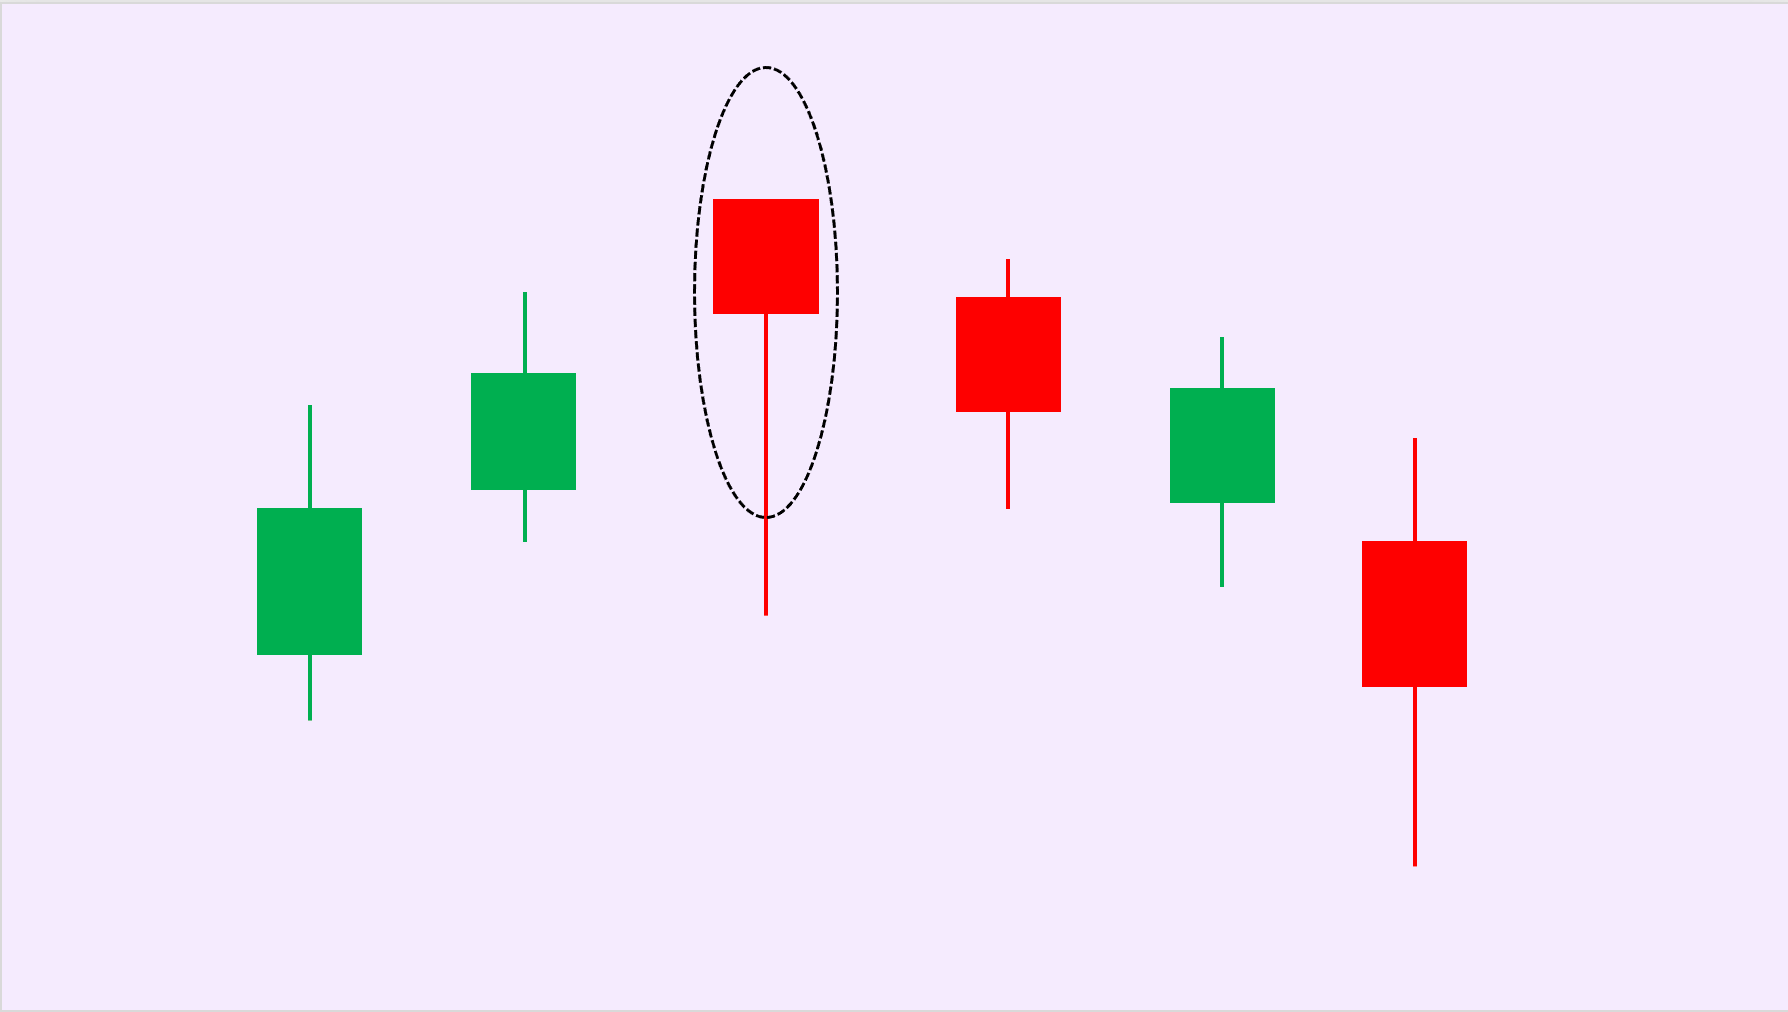
15. Hanging Man
This is a small-bodied candlestick, bullish or bearish, with a relatively long lower shadow that appears during an uptrend. It's a topping signal.
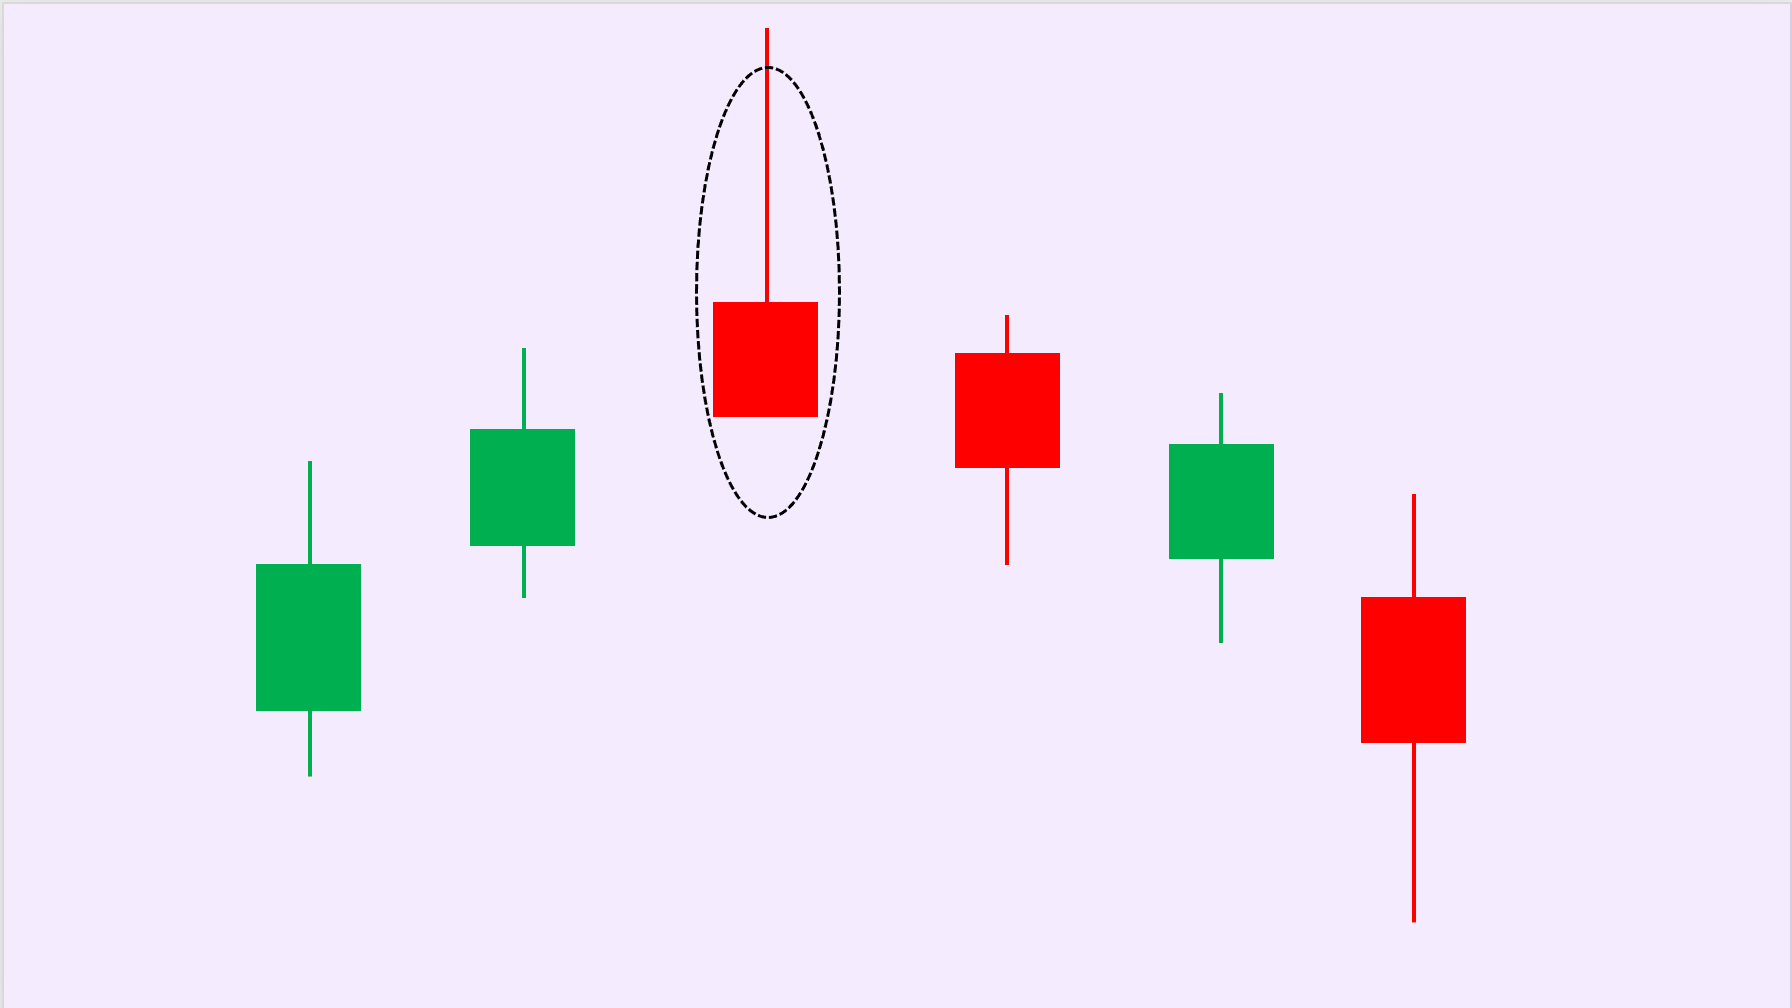
16. Shooting Star
This pattern, appearing during an uptrend, is a relatively reliable reversal signal. Its upper shadow is more than twice the length of the real body, and there's no lower shadow.
AscendEX LingDong Academy on Futures Investment - Lesson 4: Bollinger Bands and Application
2023-09-15
Futures Investment with AscendEX LingDong Academy - Lesson 3: Moving Averages and Their Applications
2023-09-08
Futures Investment with AscendEX LingDong Academy - Lesson 2: Common Candlestick Patterns
2023-09-01
Mainstream Crypto Project 2 – Stablecoin USDT
2022-04-12
Mainstream Crypto Project 1 – Ethereum
2022-04-02